
Geek hub
Quit whining!
Are e-bikes too loud?
By Frank Demesmaeker
How did you celebrate World Bicycle Day this year? As a keen cyclist, I just had to get out on my bike. I’m one of many people across the world who have recently invested in an e-bike and, let me tell you, they make riding even more fun than usual.
For the uninitiated, an e-bike is a conventional bicycle with a motor powered by a rechargeable battery that supports your pedalling power, allowing you to go much further before you get tired out.
Cycling purely for pleasure is great, but as I’m an engineer I’m intrigued by how these modern bikes work and so I decided to carry out some tests whilst I got some fresh spring air and exercise.
Naturally, one of the key elements of an e-bike is its operating range – how long the battery lasts. You can already find plenty of studies and statistics on battery performance, so I wanted to look at another important aspect of the e-bike that gets far less attention.
How much noise does an e-bike make? Motors make noise, there’s no getting away from it. Sure, these motors are very small compared to those you’d find in a car, but they’re still not silent. You can assess the noise generated in decibels with a sound level meter, but I wanted to understand more than that – what is the overall sound and vibration comfort that e-bike riders experience?
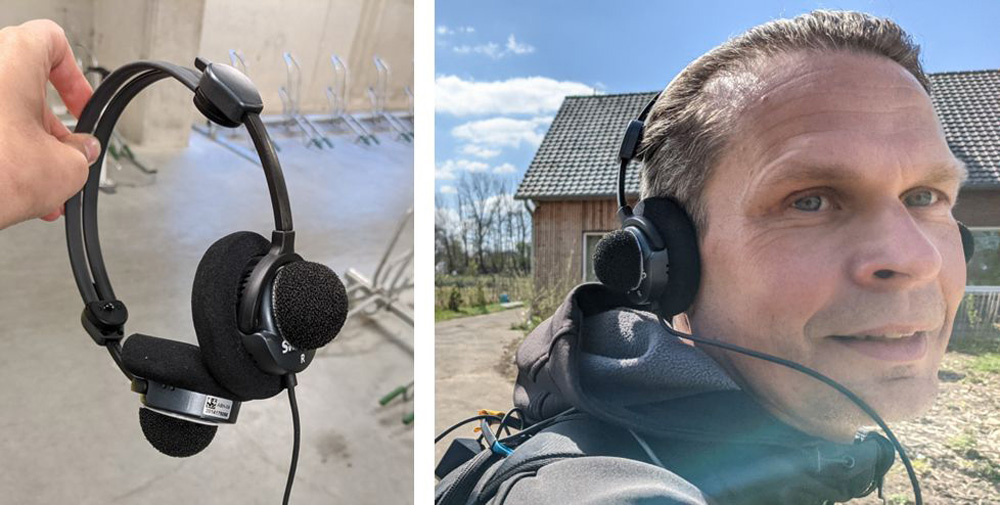
To do this, I needed something that was small enough to carry on my bike, yet powerful enough to capture all the data I needed. The Simcenter SCADAS XS is a handheld device designed to give full flexibility for noise and vibration testing so it was perfect for the task. It has 12 input channels so as well as using its binaural headset I attached the following sensors to my bike to capture as much data as possible:
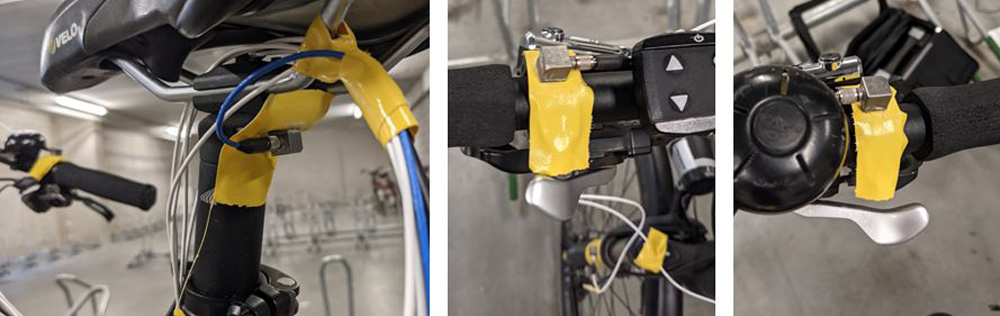
- Seven accelerometers at different locations covering all the main parts of the bike: handlebars, suspension, saddle, frame,
- Wind screened microphone close to the electric motor,
- GPS signal for speed, position and altitude, and
- GoPro camera to keep a visual record of my journey.
With the sensors and cables securely taped to the bike frame I could simply switch the Simcenter SCADAS XS on and slip it into my backpack, whilst monitoring the data from a wirelessly connected tablet. All the data is saved on the internal memory card inside the Simcenter SCADAS XS and its internal battery gives a full day of riding without worrying about running out of power. All I had to do was pedal away (with a little boost from the electric motor) and let the Simcenter SCADAS XS record all the noises and vibrations as I went over different surfaces and up and down hills.
Analysing the data I had a great ride, but the fun really began afterwards when I looked at all the data I’d recorded.
First, I used Simcenter Testlab Neo to generate a visual representation of the noises and vibrations captured. It’s a really intuitive tool which allows you to easily select the sensors in the pivot table and then automatically adds the corresponding signals to create an event image of your journey.
See how the software also allows you to combine video from the GoPro and GPS data to make it easy to see the exact point that each event occurred? Pretty cool, I think!
Did you feel that? Here in Belgium, cobblestone paths are rather popular. I already knew that they are more uncomfortable to ride over than a smooth path, but I wanted to understand just how much difference it makes.
The vibration data collected from the sensors attached to the Simcenter SCADAS XS can be used to visualise frame and suspension deformations, and to quantify the ride comfort using ISO human body vibration standards.
Using the measured vibrations on the frame with time domain animation and operational model analysis I created an animation of what was happening during my ride.
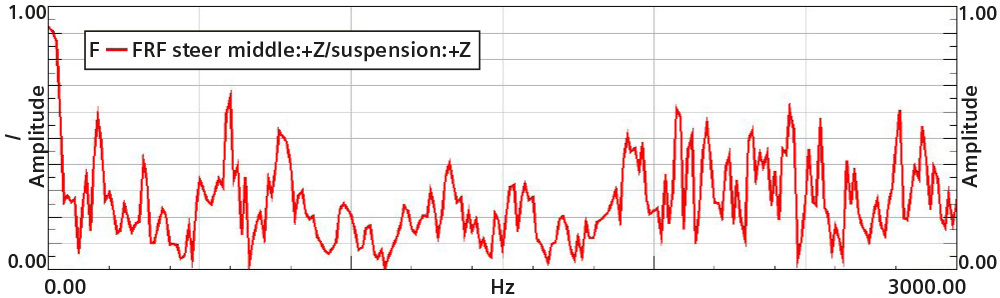
Then from the measured vibrations on the front suspension I created a graph characterising the damping efficiency of the suspension as a function of frequency.
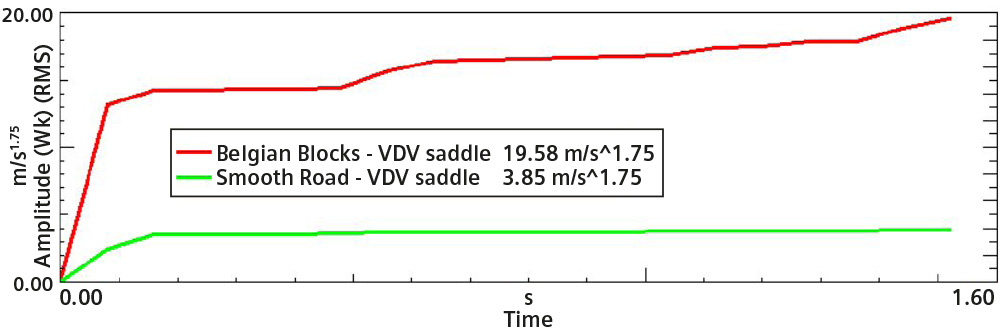
And using the handlebar and saddle vibrations I produced an evaluation of ride comfort based on ISO2631 human body vibration standards.
As you can see, it’s clear that riding on these Belgian Blocks is considerably less comfortable than riding on a smooth road.
What’s that noise? Before investigating the sound produced by the motor itself, I had to understand how much noise was generated by the road surface. I cleaned up the data collected from riding over both cobbled and smooth paths using sound quality metrics such as Articulation Index, Prominence Ratio, and Time Varying Loudness as well as adding traditional SPL and Spectrum analysis.
As you’d expect, the noise generated by the cobbled surface masked the whine of my electric motor. The prominence ratio for the smooth road measurement was 2 dB higher, but all the other metrics reported that the cobblestone road had a very negative impact on my acoustic comfort.
However, the problem with conducting a test like this in a public space on a sunny spring day is there were lots of other people and animals enjoying the weather and generating extra noise. So, to do a really thorough acoustic assessment I needed to collect some extra measurements in a controlled environment.
Fortunately, I have several colleagues who are equally enthusiastic cyclists so I asked three of them to bring their e-bikes so we could benchmark them alongside mine.
All the bikes sound different, despite three having the same motor, but that’s because it is integrated differently in each one. And the initial tests showed that one bike was generating some unusually strong high-frequency noise.
After using the interactive audio filtering, it became clear what the issue was – the bike was suffering from a prominent break squeal noise, with peak amplitudes around 12.500 Hz. This might not be a concern for everyone though, as it’s common for anyone over the age of 50 to be unable to hear high frequency noises such as this.
But to make a fair comparison of the motor noise it was important to filter out the break squeal which resulted in an impressive 15 dB drop in the prominence ratio. Now the playing field was levelled, the clear winners were bikes B and C which had high articulation index values, prominence ratio at around 7.5dB and 9 sones of loudness. Bikes A and D, however, affected speech intelligibility and resulted in higher loudness and tonality levels.
Is this accurate? Of course, no matter how much you can prove with equipment and data, it’s important to confirm your findings by conducting a subjective listening test. Jury Testing collects feedback from a group of listeners to understand their preference towards one sound or another. This is crucial when benchmarking against competitors, designing new sound quality targets (how much loudness is too much), or creating combined sound quality metrics that represent a certain product feature (pleasantness, robustness, sportiveness etc)
In this example a randomly created pair of sounds is played to the juror and they are asked to answer the question “Which of these e-bikes would you take on a long ride?”. They are given a 5 point scale (as per Sheffe’s method) to allow for more freedom in their answer:
- Definitely A,
- Rather A than B,
- Either would be fine,
- Rather B than A, and
- Definitely B.
Normally this would be repeated several times with several jurors, and a ranking produced at the end for the most to least preferred. Unfortunately, due to COVID-19 restrictions, we weren’t able to organise these tests, but rest assured, we will when it is safe to do so as I’m eager to confirm my findings!
Great thing come in small packages It’s amazing how much analysis you can carry out with the data collected from the handheld Simcenter SCADAS XS, don’t you think?